CO2412
Computational-Thinking
CO2412 Computational Thinking Contents
Lecture 13 - Info Representation
Lecture 14 - Numeric Data Analysis.pdf
Numeric Data Analysis
Learning Objectives
Describe the properties of Central Tendency, Variation, and Shape in Numerical Data.
To calculate descriptive summary measurements for a population.
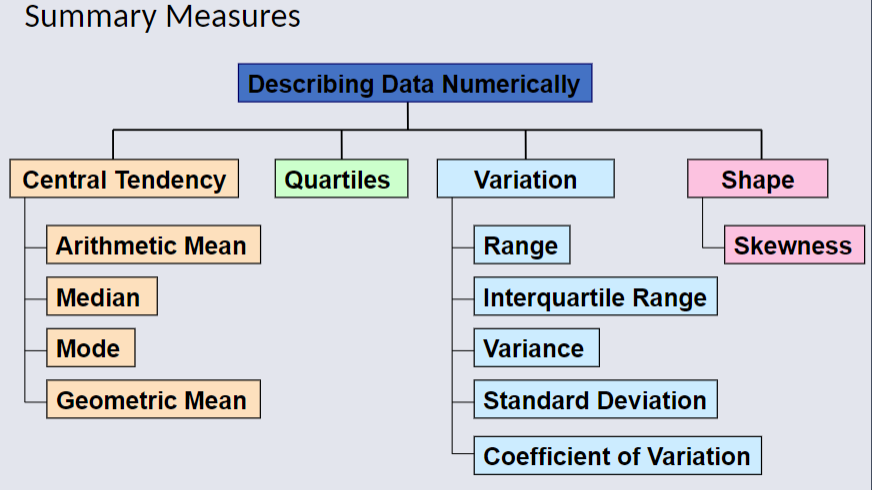
Measures of Central Tendency, Variation, and Shape
- Mean, Median, Mode, Geometric Mean
- Quartiles
- Range, Interquartile Range, Variance, and Standard Deviation, Coefficient of variation, Z-Scores
- Symmetric and Skewed Distributions
Population Summary Measures
- Mean, Variance, and Standard Deviation
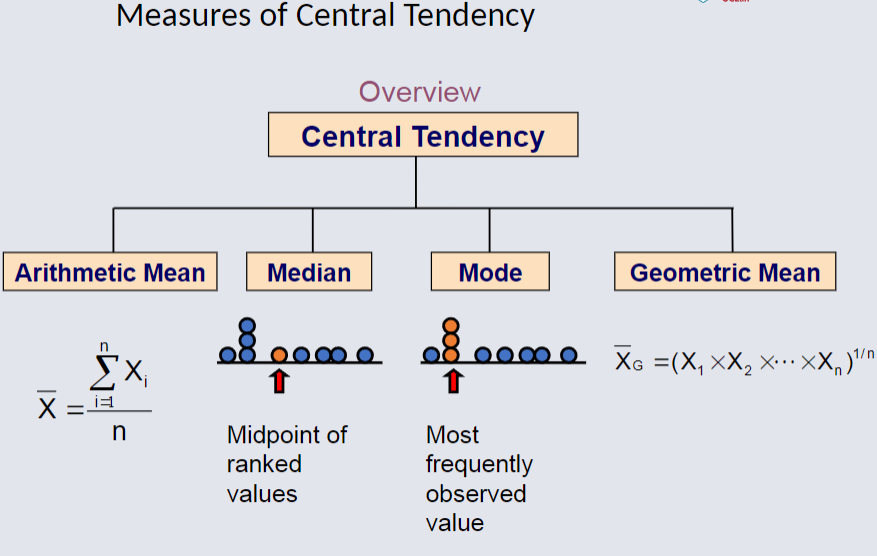
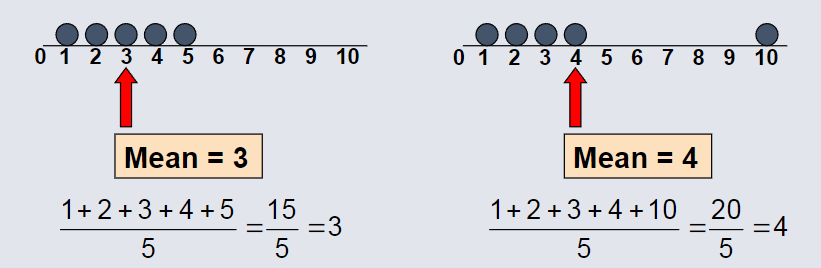
Arithmetic Mean
The arithmetic mean (sample mean) is the most common measure of central tendency.
For a sample of size n:
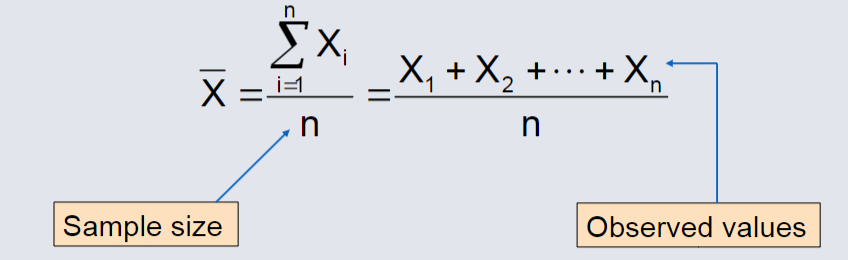
The most common measure of central tendency.
Mean = sum of values divided by the number of values.
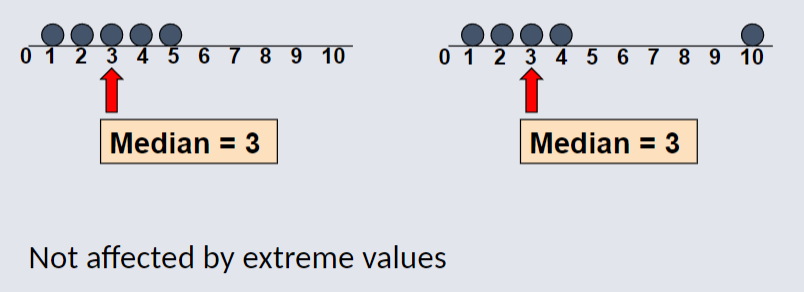
Median
In an ordered array, the median is the middle number (50% above, 50% below).
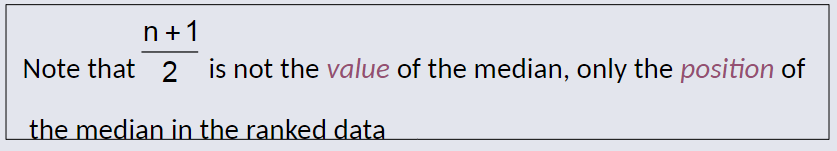
Finding The Median
The location of the median uses the following formula:
Median Position = (n + 1) / 2
N being the position in the ordered data.
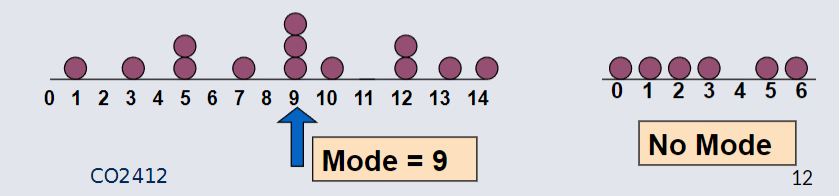
Mode
A measurement of central tendency.
Value that occurs most often, and is not effected by extreme values.
Used for either numerical or categorical data.
There may be no mode.
There may be several modes.
Example Mode
Review Example: Summary Statistics
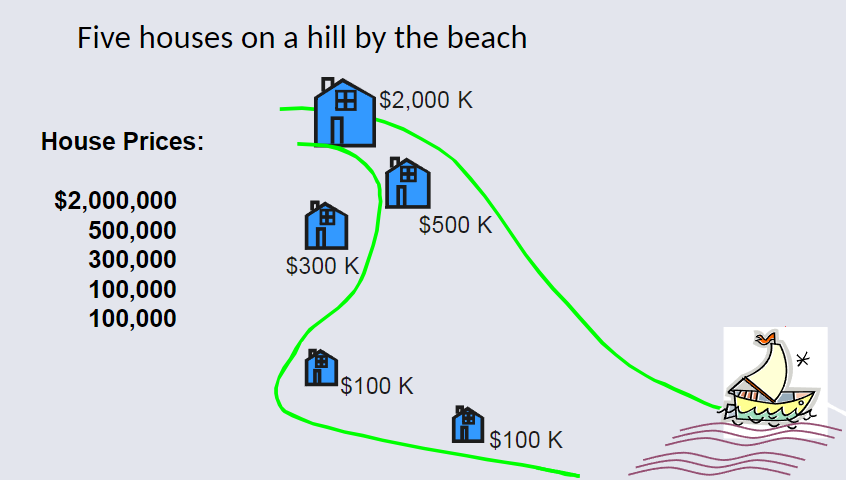
Mean: 3000000 (total sum of house prices) / 5 (total amount of houses)
Median: Middle value of ranked data: 300000
Mode: Most Frequent Value = 100000
Which measure of location is best
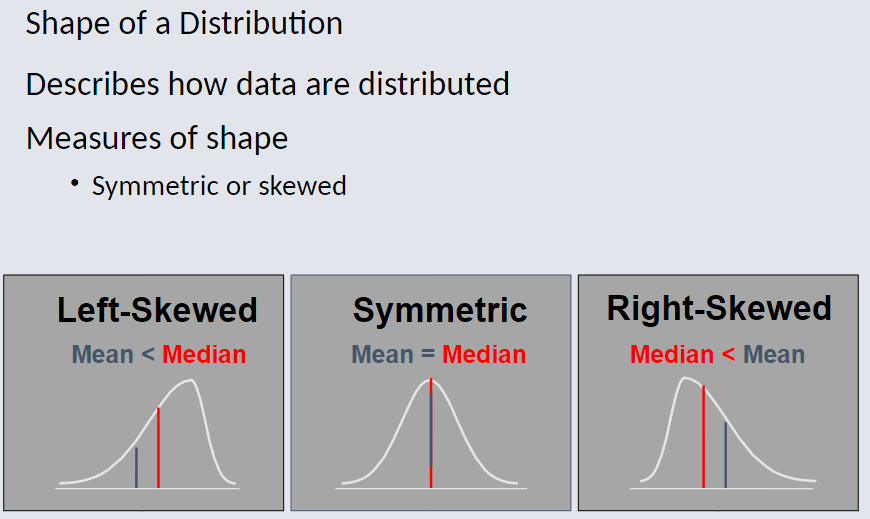
Mean is generally used, unless extreme values (outliers) exist.
Median is second often used since the median is not sensitive to extreme values.
In regards to median with House Example:
Median home prices may be reported for a region as it is less sensitive to outliers.
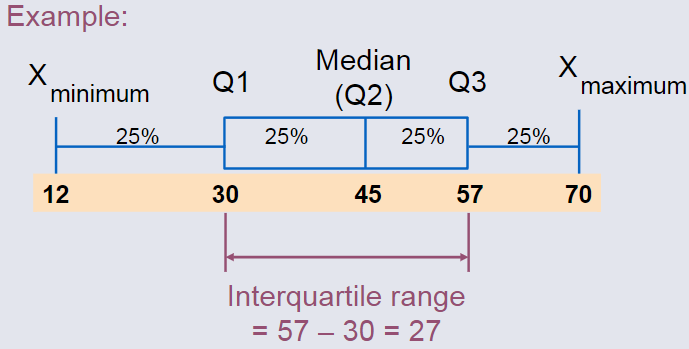
Quartiles
Quartiles split the ranked data into 4 segments with an equal number of values per segment.
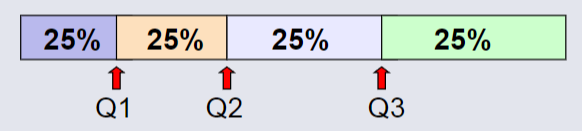
The first quartile Q1 is the value for which 25% of the observations are smaller and 75% are larger.
The second quartile Q2 is the same as the median (50% are smaller, 50% are larger)
Only 25% of the observations are greater than the third quartile Q3.
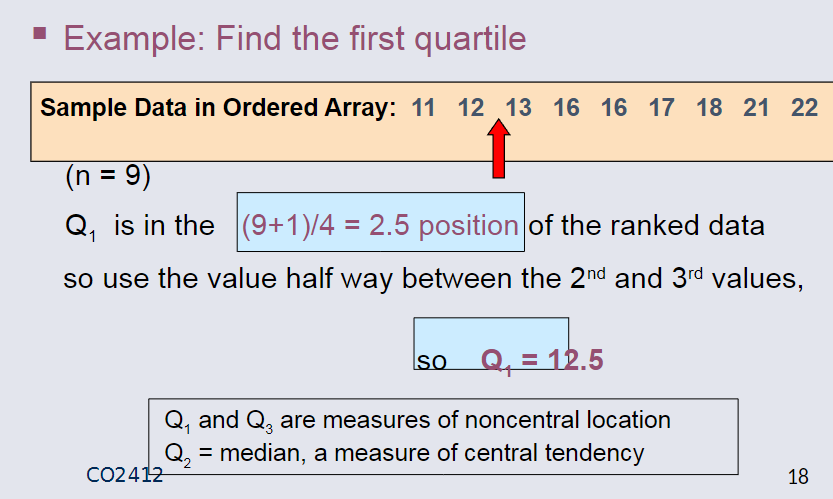
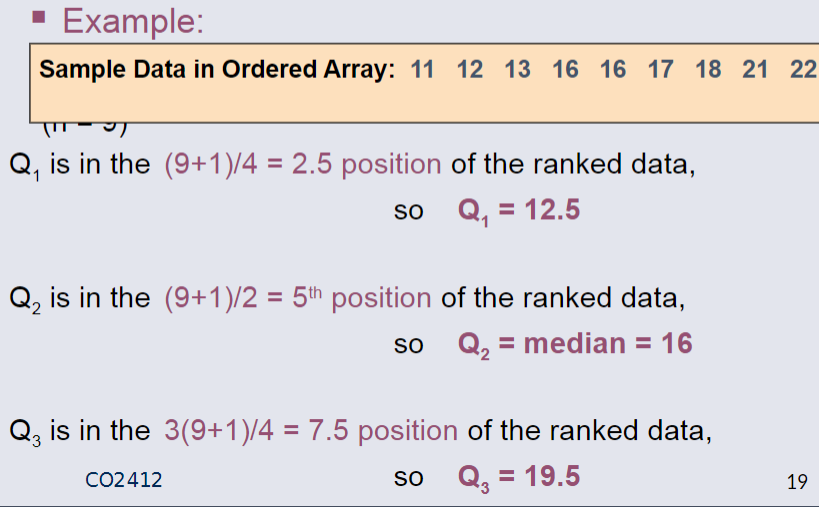
Quartile Formulas based on Example
Q1 = (n + 1) / 4
Q2 = (n + 1) / 2 (The Median Position)
Q3 = 3(n + 1) / 4
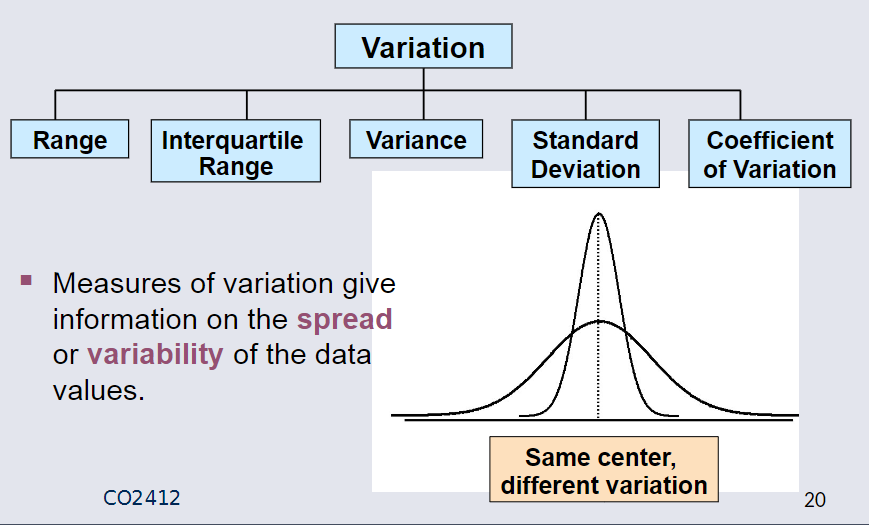
Measures of Variation
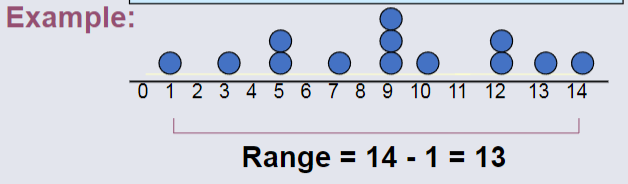
Range
Simplest measure of variation.
Difference between the largest and the smallest values in a set of data:
Range = Largest Value - Smallest Value
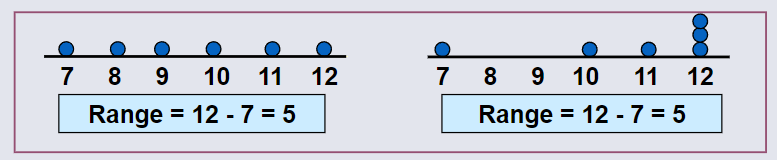
Example Range
Disadvantages of Range
-
Ignores the way in which data is distributed.
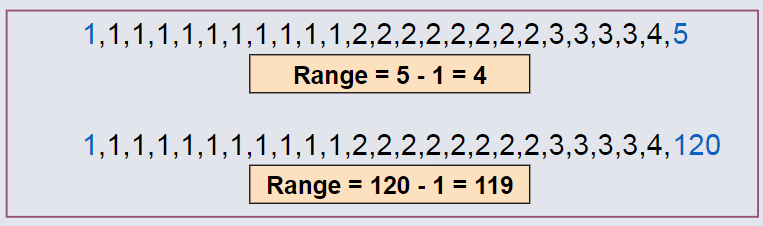
-
Sensitive to Outliers
Interquartile Range
Can eliminate some Outlier problems by using the Interquartile Range.
Eliminate some high- and low-valued observations and calculate the range from the remaining values.
Interquartile Range = 3rd Quartile - 1st Quartile
Example Interquartile Range
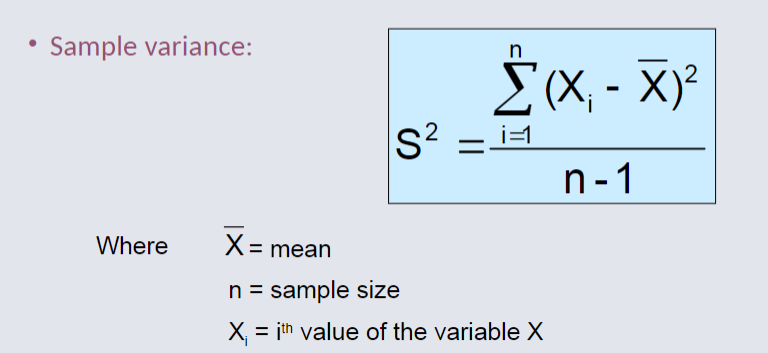
Variance
Average (Approx) of squared deviations of values from the mean.
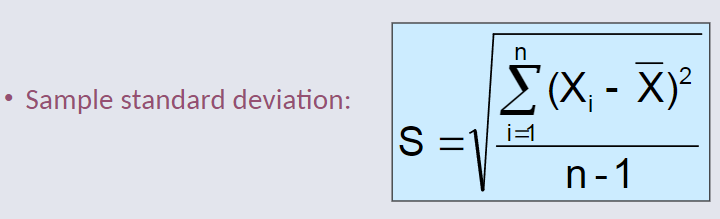
Standard Deviation
Most commonly used in measure of variance.
Shows variation about the mean
Has the same units as the original data
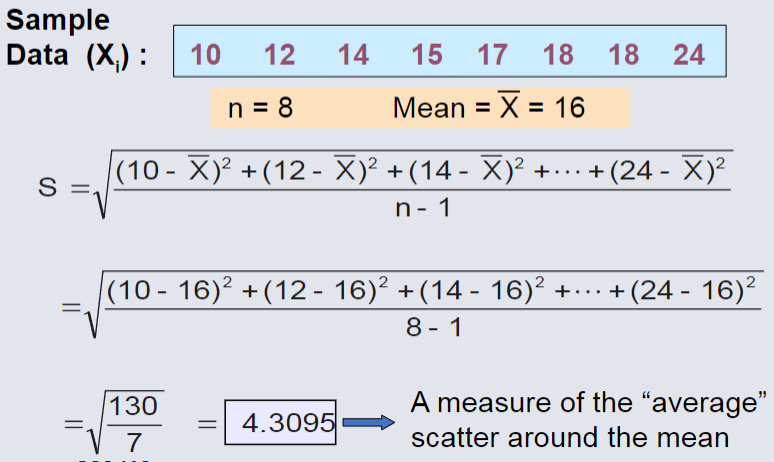
Example Standard Deviation
Measuring Variation
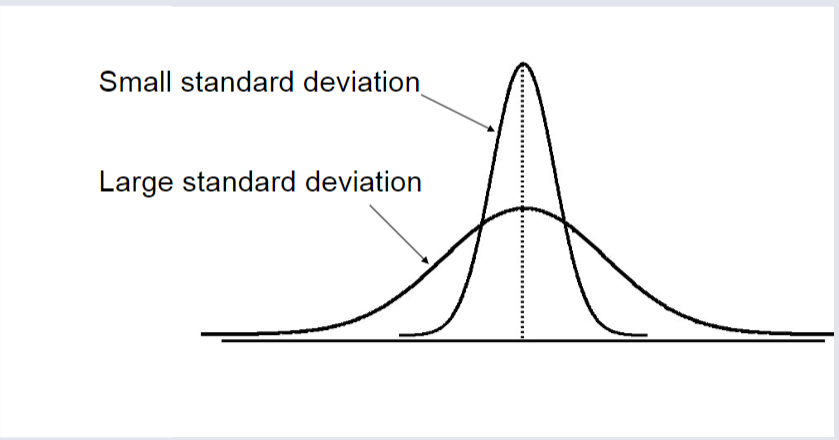
Comparing Standard Deviations
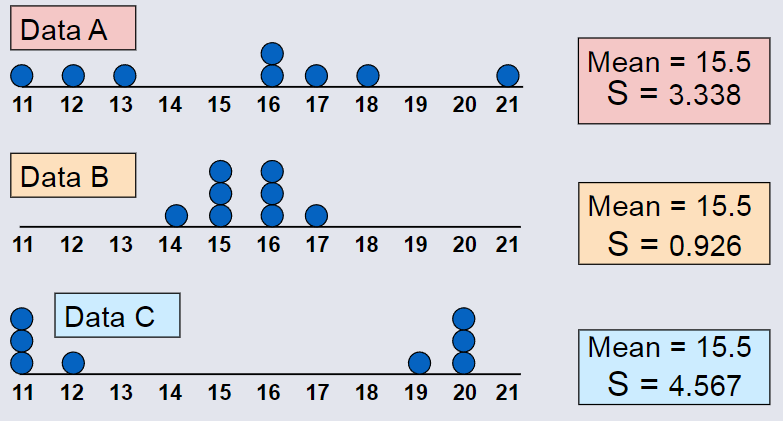
Advantages of Variance and Standard Deviation
- Each value in the dataset is used in the calculation
- Values far from the mean are given extra weight (Because deviations from the mean are squared)
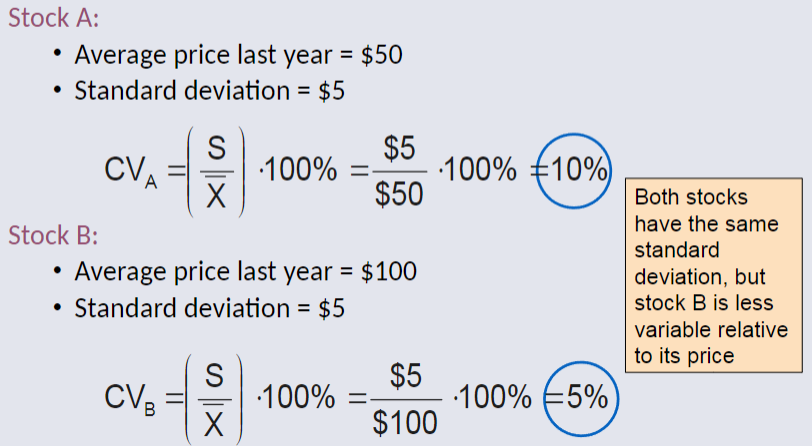
Coefficient of the Variation
Measures relative variation.
Always in Percentage (%)
Shows Variation Relative to Mean
Can be used to compare two or more sets of data measured in different units.
![[Pasted image 20250426223524.png]]
Comparing Coefficient of Variation
Shape of Distribution