CO3722 Data Science
CO3722 Lecture 5 - Data Analysis using Visualisations
Lecture Documents
Written Notes
Learning Objectives
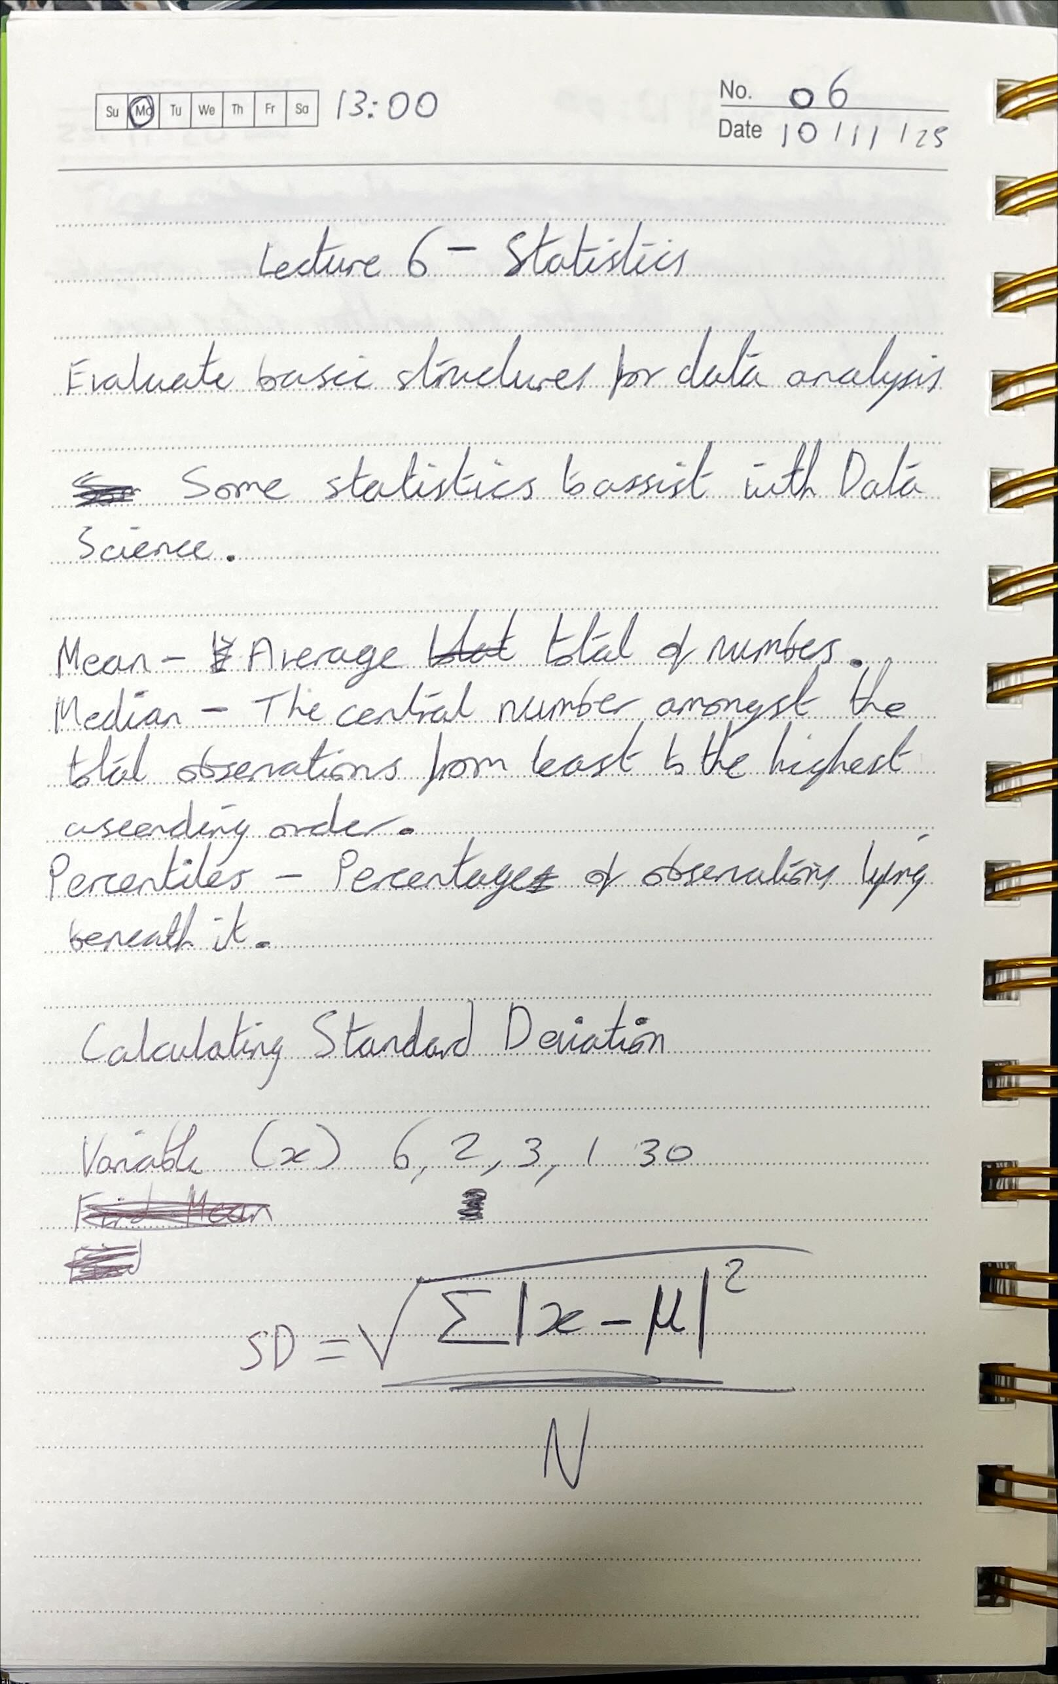
- Evaluate basic statistics for data analysis.
Some Statistics to Assist with Data Analysis
- Mean
- Median
- Percentiles
- Standard Deviation
Calculating Standard Deviation
SD Formula
Task
Calculate the following:

Variable (x): 6, 2, 3, 1
Find the mean
Square (x-mean)
Sum results
Divide by number of data points
Square root to find SD
Task Working
Calculating Mean from Data
Calculating Deviations
Squaring Deviations
Add Results
Divide Number of Data Points
Square Root to Find SD
Calculating Again with Additional Value
Dataset
Mean
Deviations
Squaring Deviations
Adding Results
Square Root to Find SD
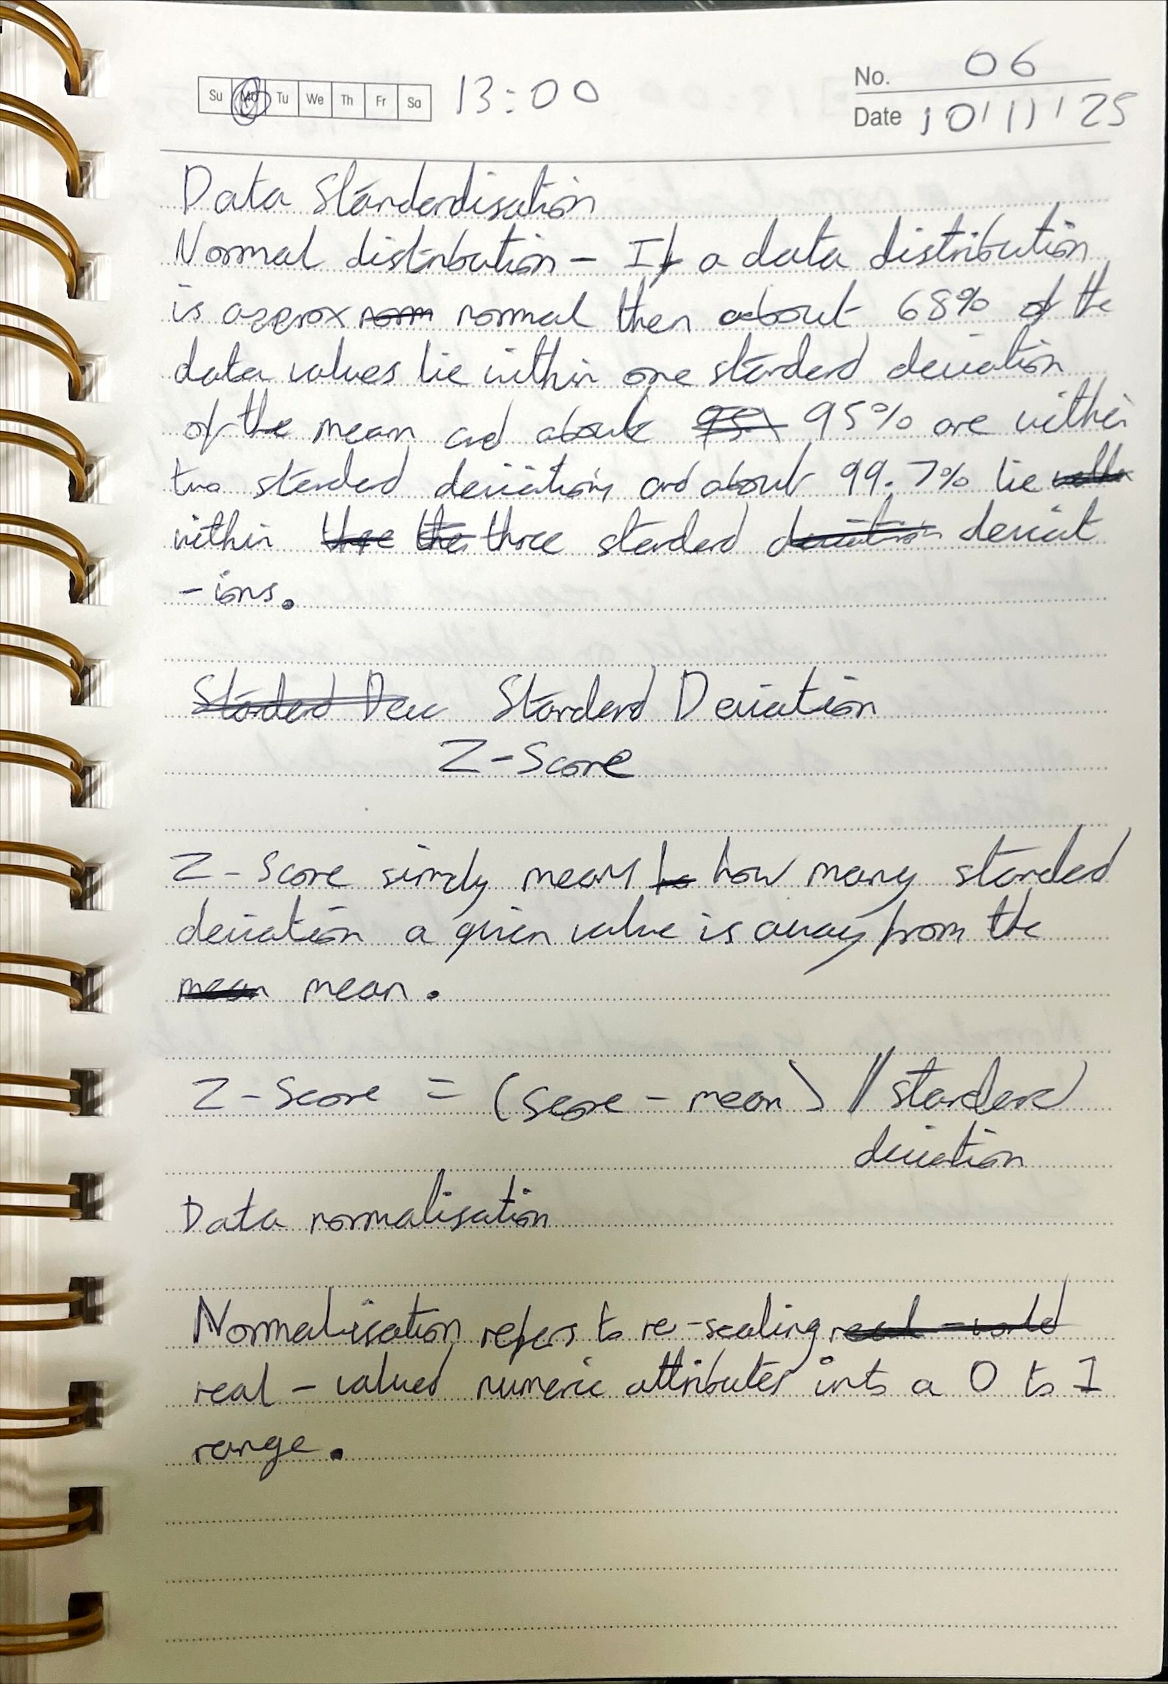
Normal Distribution
If a data distribution is approximately normal then:
- 68% of the data values lie within one standard deviation
- 95% are within two standard deviations.
- 99.7% lie within three standard deviations.
Standard Deviation - Z-Score (Variance)
The Z-Score simply means how many standard deviations a given value is away from the distribution mean.
Z-Score can either be a positive or negative value.
SM = Score Mean.
Data Normalisation
Normalisation refers to the re-scaling numeric data from its real-value into a 0 to 1 range.
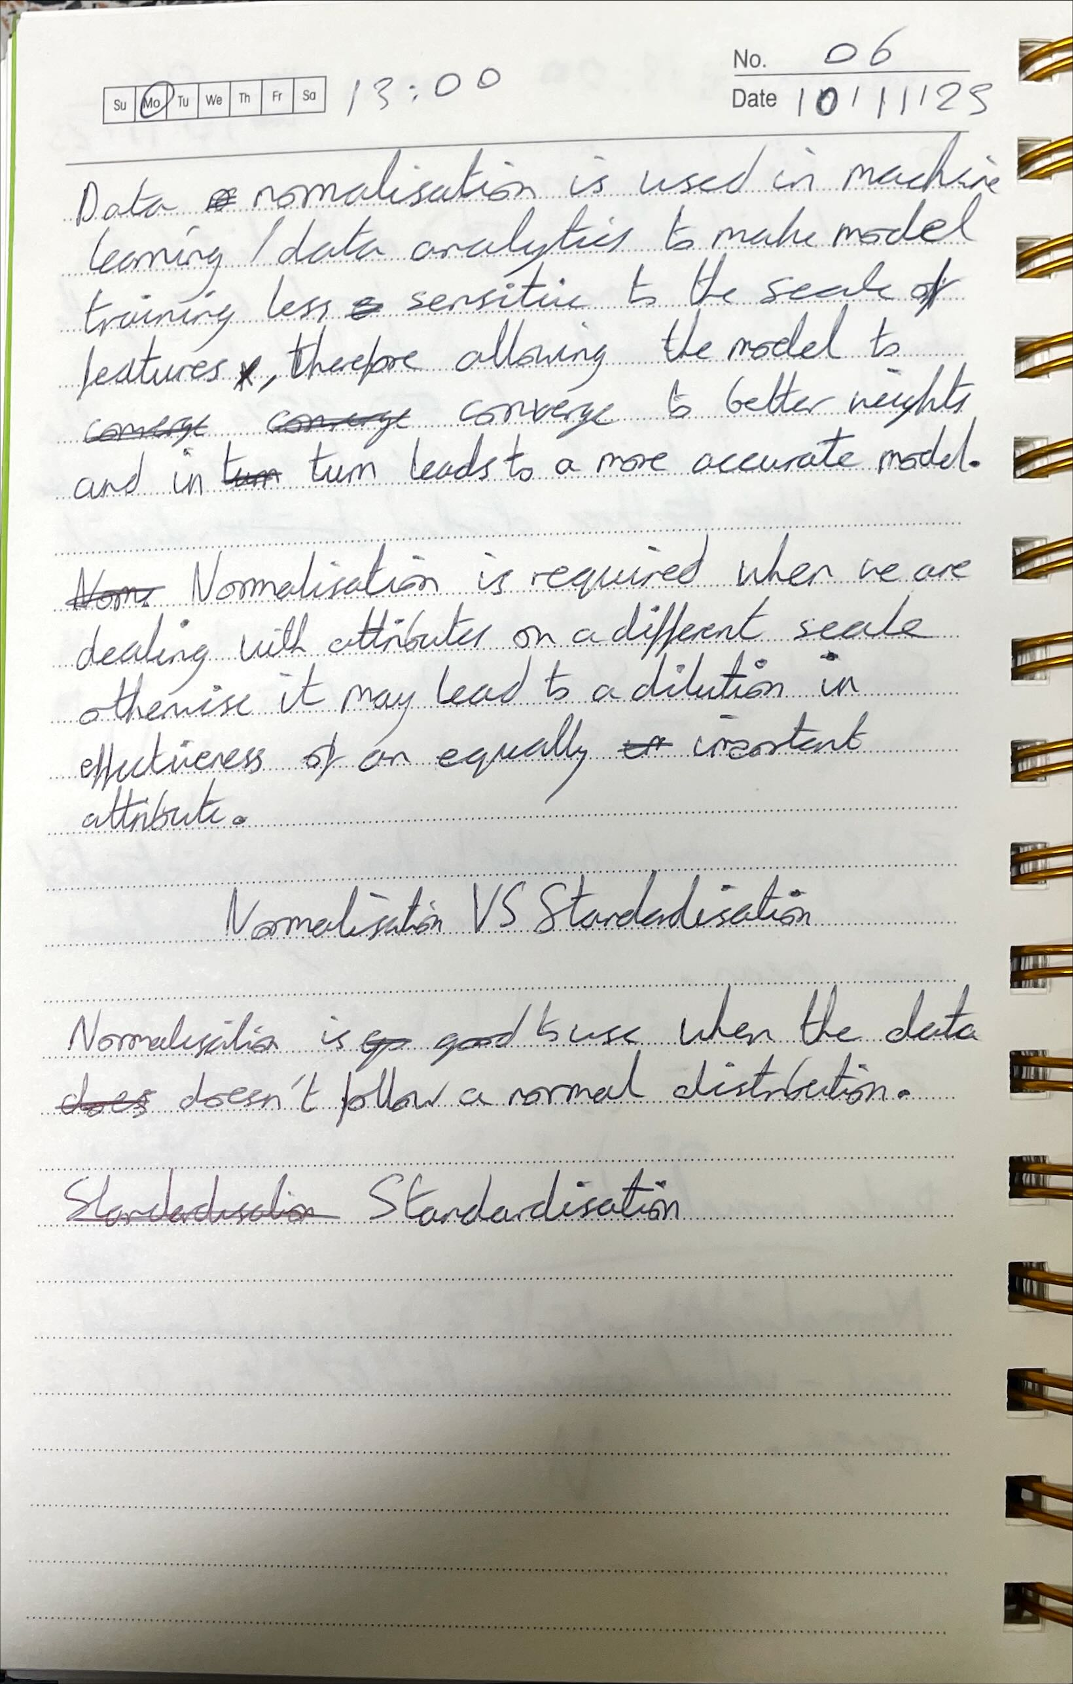
This form of normalisation is used in machine learning and data analytics make model training less sensitive to the scale of features, which allows the model to converge to better weights and overall leads to a more accurate model.
Normalization is useful when different attributes are measured on different scales. Without it, attributes with larger numerical ranges can overwhelm those with smaller ranges, even when both are equally important.
Normalisation VS Standardisation
Normalisation is good to use when the distribution of data does not follow a Normal Distribution. This is useful in algorithms which do not assume any distribution of data.
Standardisation, can be helpful in cases where data follows Normal Distribution, unlike normalisation, standardisation does not have a bounding range so even if outliers are present in the data it will not be affected by standardisation.
The choice of using normalisation or standardisation depends on the problem, and the machine learning algorithm being utilised. Therefore, there is no hard-fast rule of when to normalise or standardise data.
One potential method is by fitting the model to raw normalised and standardised data and comparing the performance for the best results.
Pandas
Summarising, Aggregating and Grouping Data
The pandas library makes the calculation of different statistics very simple by including pre-built functions of mean, max, min, and standard deviation (std).
Summarisation
GroupBy
Many cases require query-based summarisation. E.g. What's the total call duration in January for a call centre dataset.
To group these categories together the groupby() pandas function can be utilised. Essentially splitting data into differing groups depending on the variable of choice. E.g. the expression data.groupby('month') will split the current DataFrame by month.
The groupby() function returns a groupBy object but essentially descirbes how the rows of the original dataset has been split.
Note
Functions like max(), min(), mean(), first(), last(), etc can be applied to the GroupBy object to obtain summary statistics for each group.
Groups can also be applied to more than one available to allow for more complex queries.