CO3722 Data Science
CO3722 Lecture 7 - Further Statistics
Lecture Documents
Written Notes
Case Study Example
Loan Predication/Approval Dataset – provide guidance for summative assessment
• Example Data Science project ‘journey’, including:
- Examining datasets – training and testing
- Asking questions and proposing hypotheses
- Visualise data – Identifying outliers
- Consider algorithm design
• Algorithms – Semester 2
Problem Statement
Example
Finance Associates deal in home loans. Customers apply for a loan which is evaluated and validated for eligibility. The company wants to automate the process in ‘real-time’, which will include details such as: gender, marital status, education, number of dependants, income, credit history and loan amount. Which customer features need identifying to target those that are eligible
- Which customer features need identifying to target those that are eligible?
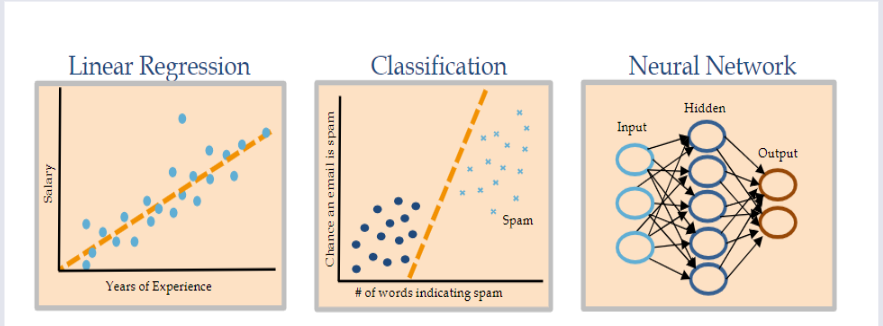
Loan Prediction Problem
Classification Problem
- Binary (Yes/No, Win/Loss...)
- Multiclass (Classifying groups i.e. breads of animals, categories of movies)
- What is the hypothesis; prediction or research question?
Read/Examine Dataset
- Train and Test datasets (Taken from kaggle.com)
- Examine the structure of the datasets
- How many variables and type of data i.e.
Target variable: Loan_Status
Understand/Describe Dataset
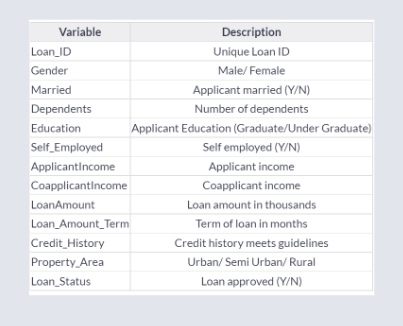
- Mixture of categorical, ordinal, and numerical fields.
Import Libraries Recap
Pandas for DataFrames.
Numpy for calculations.
Seaborn for visualisations.
MatplotLib for plotting graphs.
Univariant Analysis
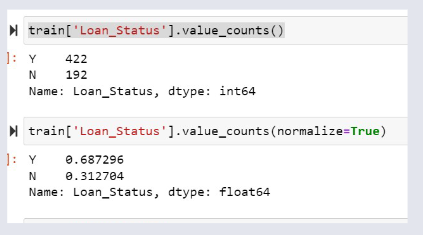
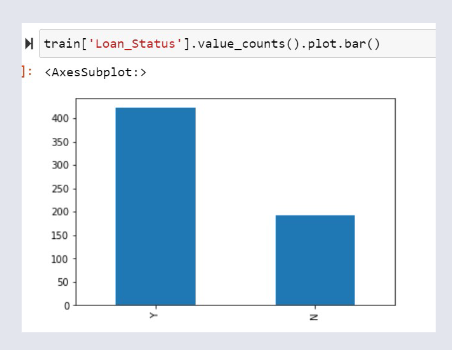
Target Variable
- Target Variable - Loan Status
- Count number of approved loans
- Normalise outcomes i.e. proportions (0 - 1 range)
Task
- Import Libraries
- Read in 'Train' dataset
- Examine dataset
- Count 'Loan Status'
Visualise Data
Subplots - Categories: Gender and Married
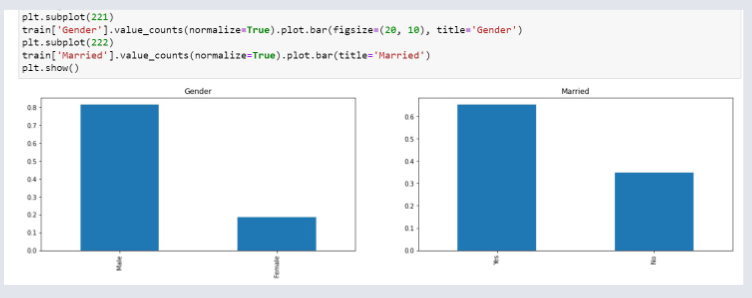
Further Categorical Features Analysis
Task
- Visualise other categorical features VS Loan Status:
- Gender, Married, Self-Employed, Credit History, Education, Dependents
- What can be inferred?
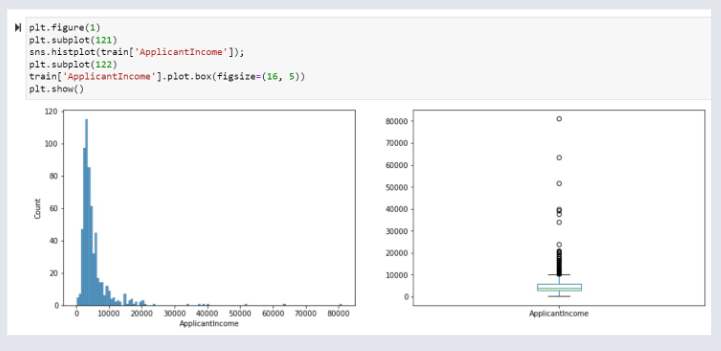
Visualise Numerical Features
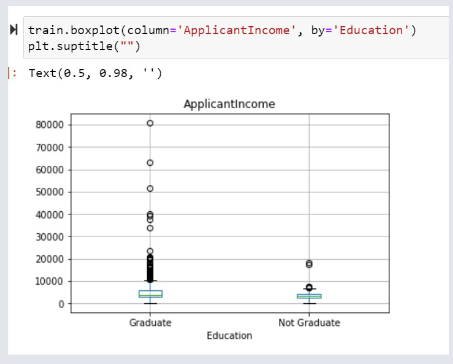
Numerical Features - Segregate by Education
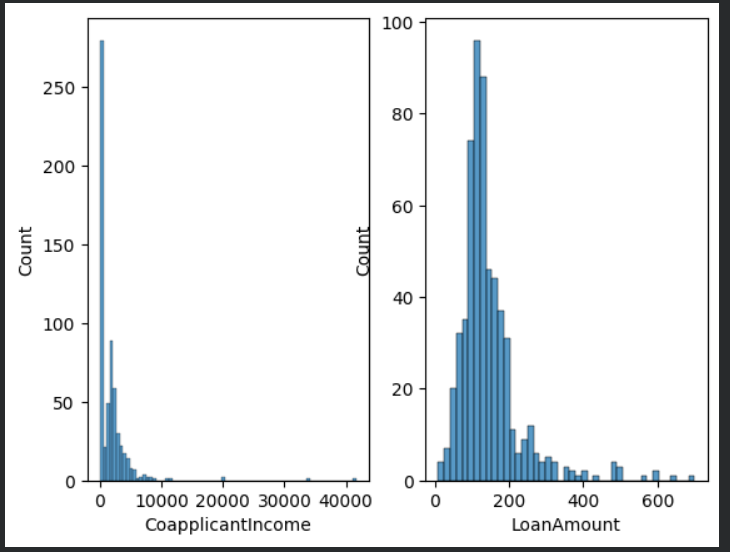
Further Numerical Features
Task - Visualise Numerical Features:
- Co Applicant's Income and Loan Amount
- Is a normal distribution seen?
- Any outliers?
- Can any assumptions be made?
plt.figure(1)
plt.subplot(121)
sns.histplot(df['CoapplicantIncome'])
plt.subplot(122)
sns.histplot(df['LoanAmount'])
plt.show()
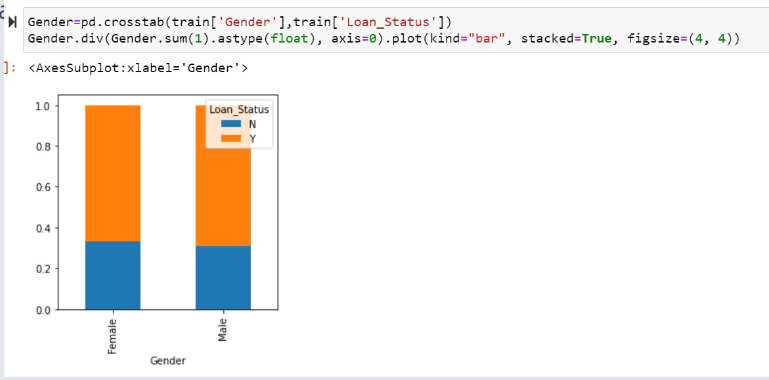
Bivariant Analysis
Categorical Features
Relationship between target variable (Loan Status) and Gender.
Task - Visualise other categorical variables including:
- Married
- Dependents
- Education
- Self Employed
Numerical Features
Relationship between target variable (Loan Status) and Combined Total Income (Applicant and Co-Applicant)
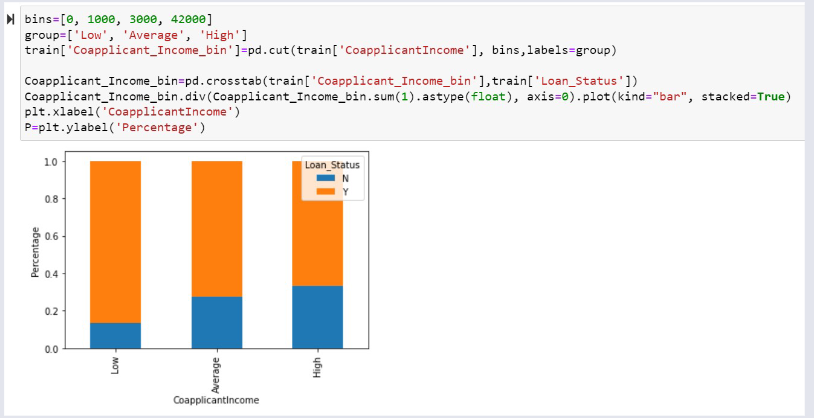
Does this support the hypothesis?
Is loan approval dependent on a co-applicant?
Combining Variables (Combined Income) for Analysis
Relationship between target variable (Loan Status) and Combined Total Income (Applicant and Co-Applicant)
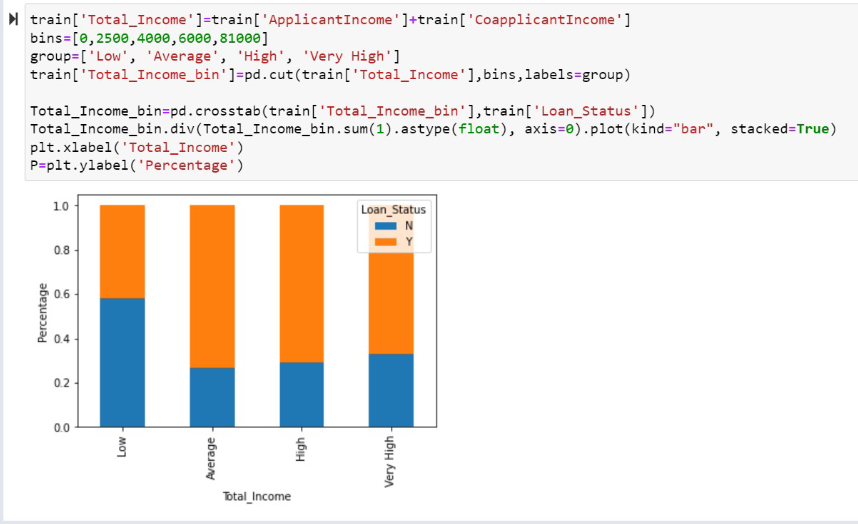
Does this provide further insight and prove the hypnosis?
Further Bivariate Numerical Analysis
Task - Visualise Loan Amount
- What proportions of loans are approved?
In summary:
What correlations can be drawn between the categorical and numerical variables analysed?
Assignment 1 Review Consider...